Is Futhark getting faster or slower?
The objective of the Futhark compiler is summarised pretty well by the official slogan gotta go fast. But how well are we living up to that? It is well known that both people and programs tend to bloat and slow down over time. We have pretty decent tools for measuring performance of Futhark-generated code, and we meticulously measure the performance of every commit, but we have no automated mechanism for identifying regressions. We usually only look at the measurements when we make a change we suspect will have an impact, or to locate a regression after the fact. This doesn’t do anything to detect the kind of gradual performance slowdown that might occur when originally finely tuned code becomes bogged down with tiny changes to support new features, each individually thought to have negligible impact.
One way of answering this question would be to analyse the historical data collected by CI. But that data is pretty low quality, as the benchmarking machines have changed software configuration (drivers and such) several times, which would obscure the impact of changes in Futhark itself. Further, we haven’t had our most powerful GPU (an NVIDIA RTX 2080 Ti) for more than about a year, so most of the historical data doesn’t cover it.
I decided that I needed entirely new data, and wrote a script to run every single release of the Futhark compiler on our benchmark suite using our OpenCL backend. Unfortunately, that’s not as simple as it sounds. Futhark as a language has changed incompatibly over the years, and it is important to match each release of the Futhark compiler with the right version of the benchmark suite. Since version 0.4.0, the Futhark Git repository points to the right version of benchmark suite as a Git submodule, but for older versions I had to manually find benchmark suite commits that would work with each version of the compiler. You never stop paying for your early sins.
The benchmark suite contains many benchmarks, and some of them have been added since the release of Futhark 0.1.0. While it would have been possible to include them, starting from the version they are introduced, I decided to restrict myself to the benchmarks that have existed across the full version span, and with only one representative dataset per benchmark As we shall see, even this cut-down collections has enough benchmarks to exceed my meagre plotting skills.
While the names of the benchmark programs have fortunately remained
unchanged over time, there have been a few changes to the names of
some of the datasets. So another mapping was needed.
Also, how you run the Futhark compiler, or its benchmarking tool,
changed around version 0.9.1. In older versions, you’d say
futhark-bench --compiler=futhark-opencl, while newer versions need
futhark bench --backend=opencl. Good thing Python supports
conditionals.
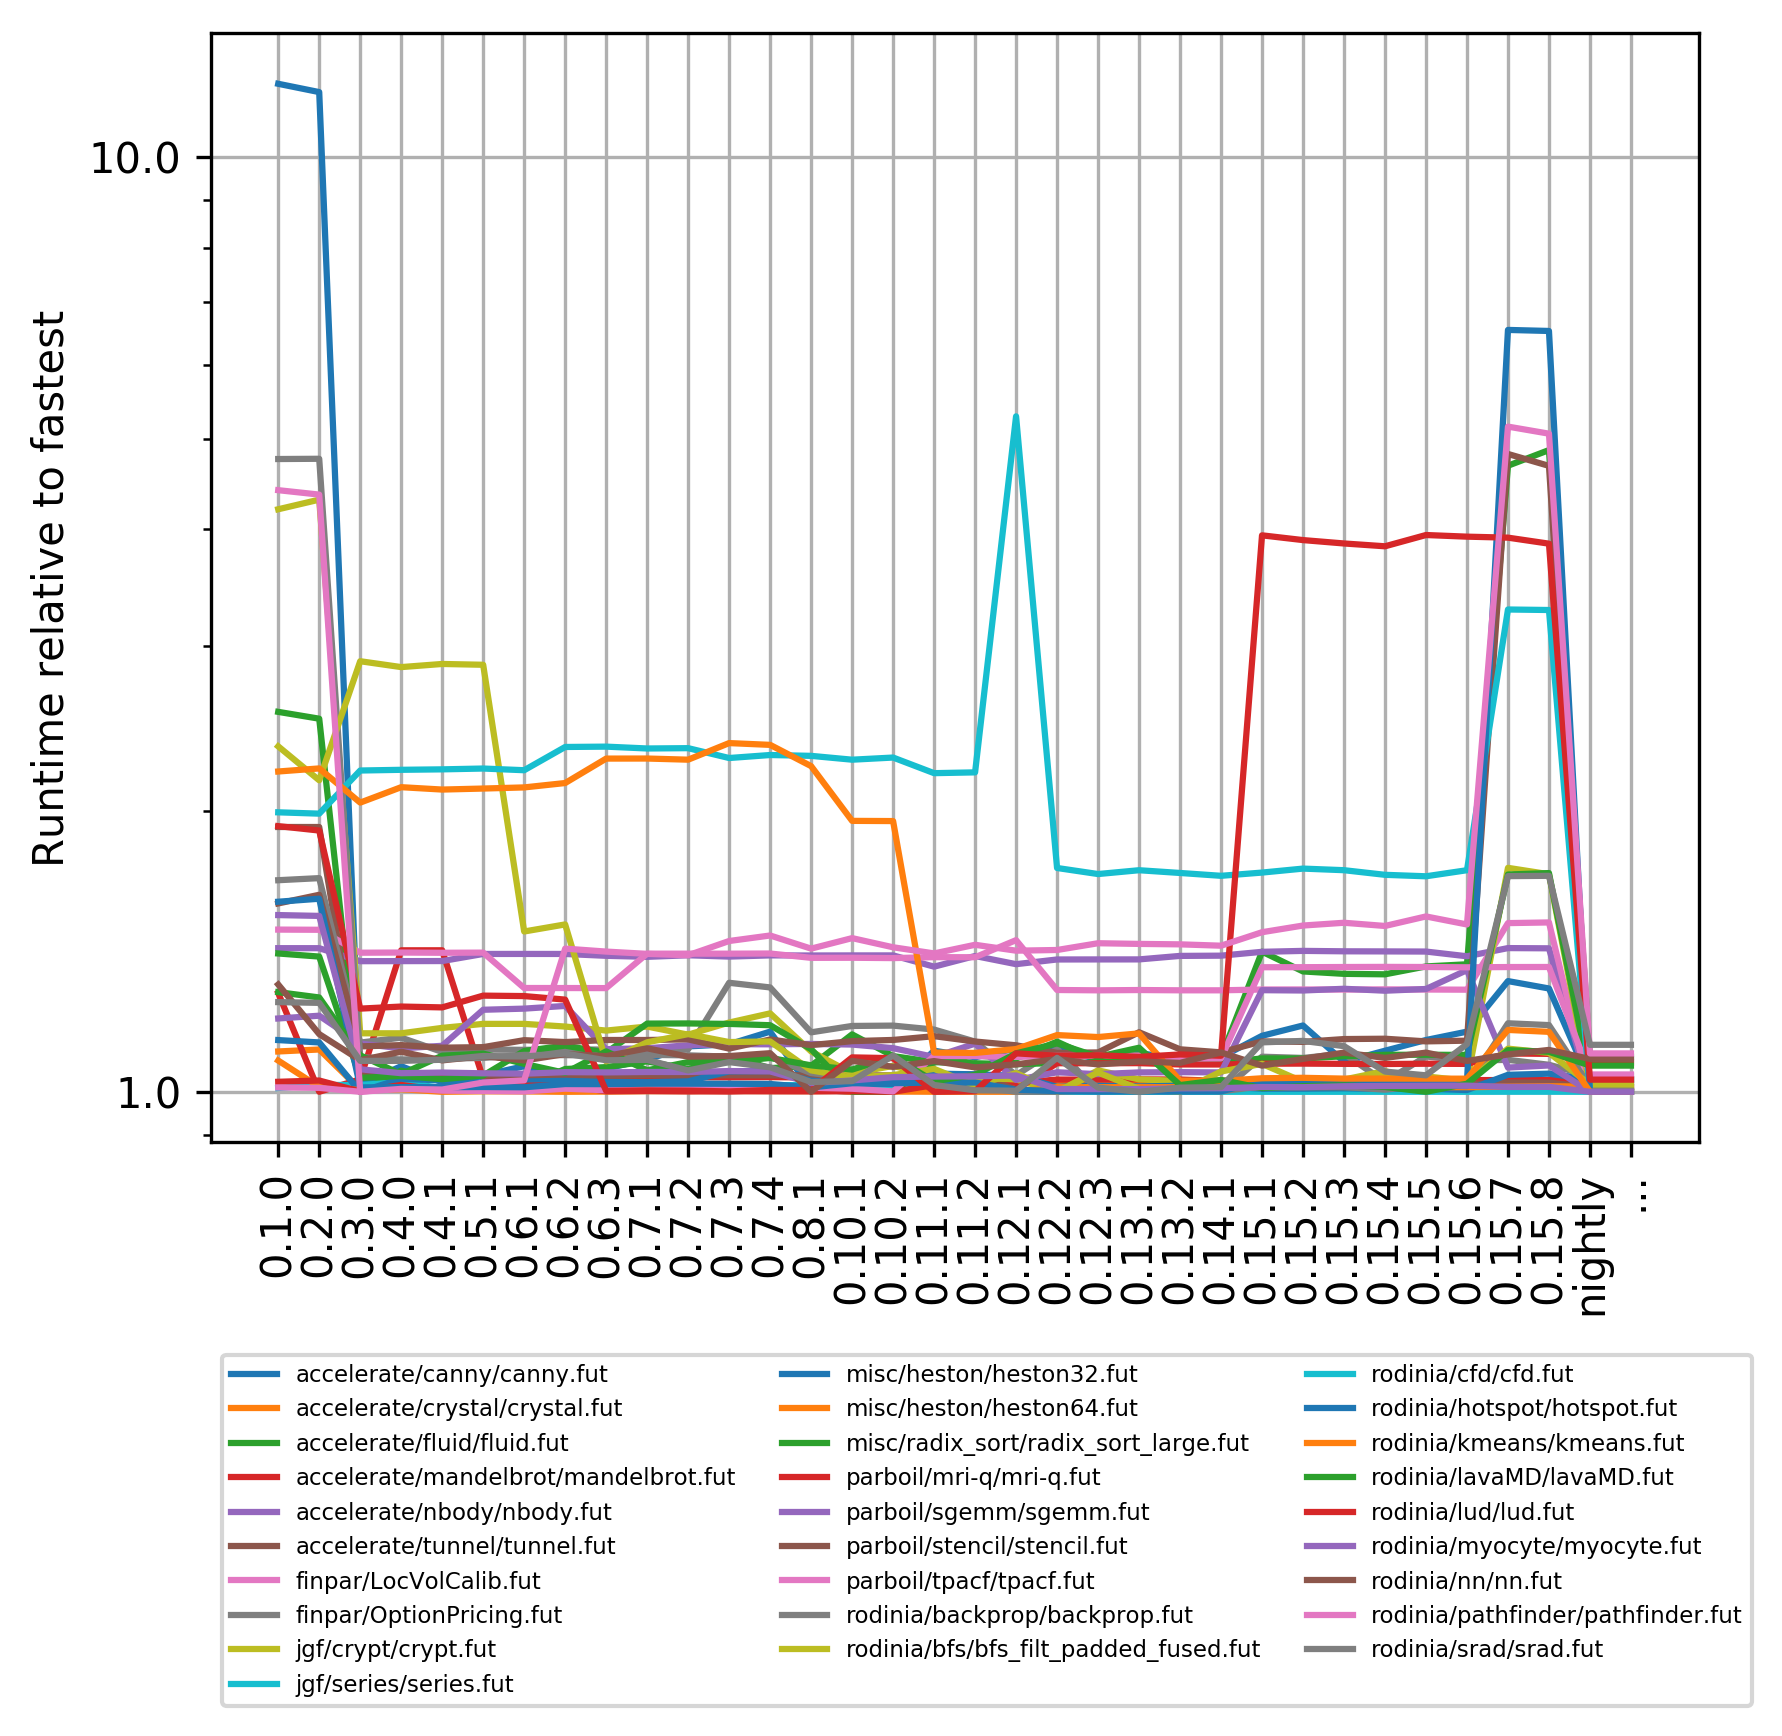
Alright, enough of that, let us look at a horrible visualisation. (Oh, one last thing: version 0.9.1 fails to validate on two of the benchmarks, so I decided to skip it entirely.) The following plot shows, for each benchmark, the relative runtime compared to the fastest observed runtime for that benchmark. Spikes represent times where the compiler was much slower for a time, and dips represent improvements in performance. Don’t look at the individual lines, as they are incomprehensible. I’ll explain some of the more interesting artefacts below.

Nightly is the rolling release corresponding to the latest commit. The simplest takeaway is that the current performance for all benchmarks is not (much) worse than the best observed performance. Hooray! But this is a pretty lively graph, so what’s really happening?
For version 0.3.0 we can see most benchmarks become vastly faster, with canny improving by an order of magnitude! This is because we introduced our own GPU memory manager rather than allocating directly from the driver.
The yellowish benchmark that speeds up significantly for 0.6.1 is the
elegantly named bfs_filt_padded_fused.
The speedup is not due to the Futhark compiler doing a much better
job, but instead due to the benchmark itself being rewritten in a
more efficient way. This is an unavoidable source of noise in this
data. Similarly, the orange line speeding up for 0.11.1 is kmeans,
and the change comes from modifying the benchmark to use the then-new
reduce_by_index function (which is explained in detail in a paper
we recently got accepted for SC20!).
The cyan line that sees a slowdown for 0.12.1 and then a speedup for 0.12.2 is cfd, and the cause was accidentally breaking part of the compiler pass that rearranges data in memory such that it can be efficiently traversed by GPU kernels. This is one of the absolute key optimisations, typically with around a factor eight impact on performance if you get it wrong. It would be nice if we had an automatic system to detect such major regressions.
The red program slowing down significantly for 0.15.1 is lud, and it looks worse than it is. What happened was that we replaced a hacked-up implementation with a much nicer one, but one which requires incremental flattening to run fast - and incremental flattening was not enabled by default until recently (and still not in any released version).
Something quite tragic and embarrassing happened with 0.15.7 and 0.15.8, where I tweaked the memory allocator in ways that had unforeseen repercussions, and it took a while to fix it.
Many benchmarks became significantly faster on nightly than they have ever been before. This is partly attributable to Philips further tweaking of the allocator, and partly due to now using the incremental flattening technique, which can result in significant speedup for programs that use nested parallelism.
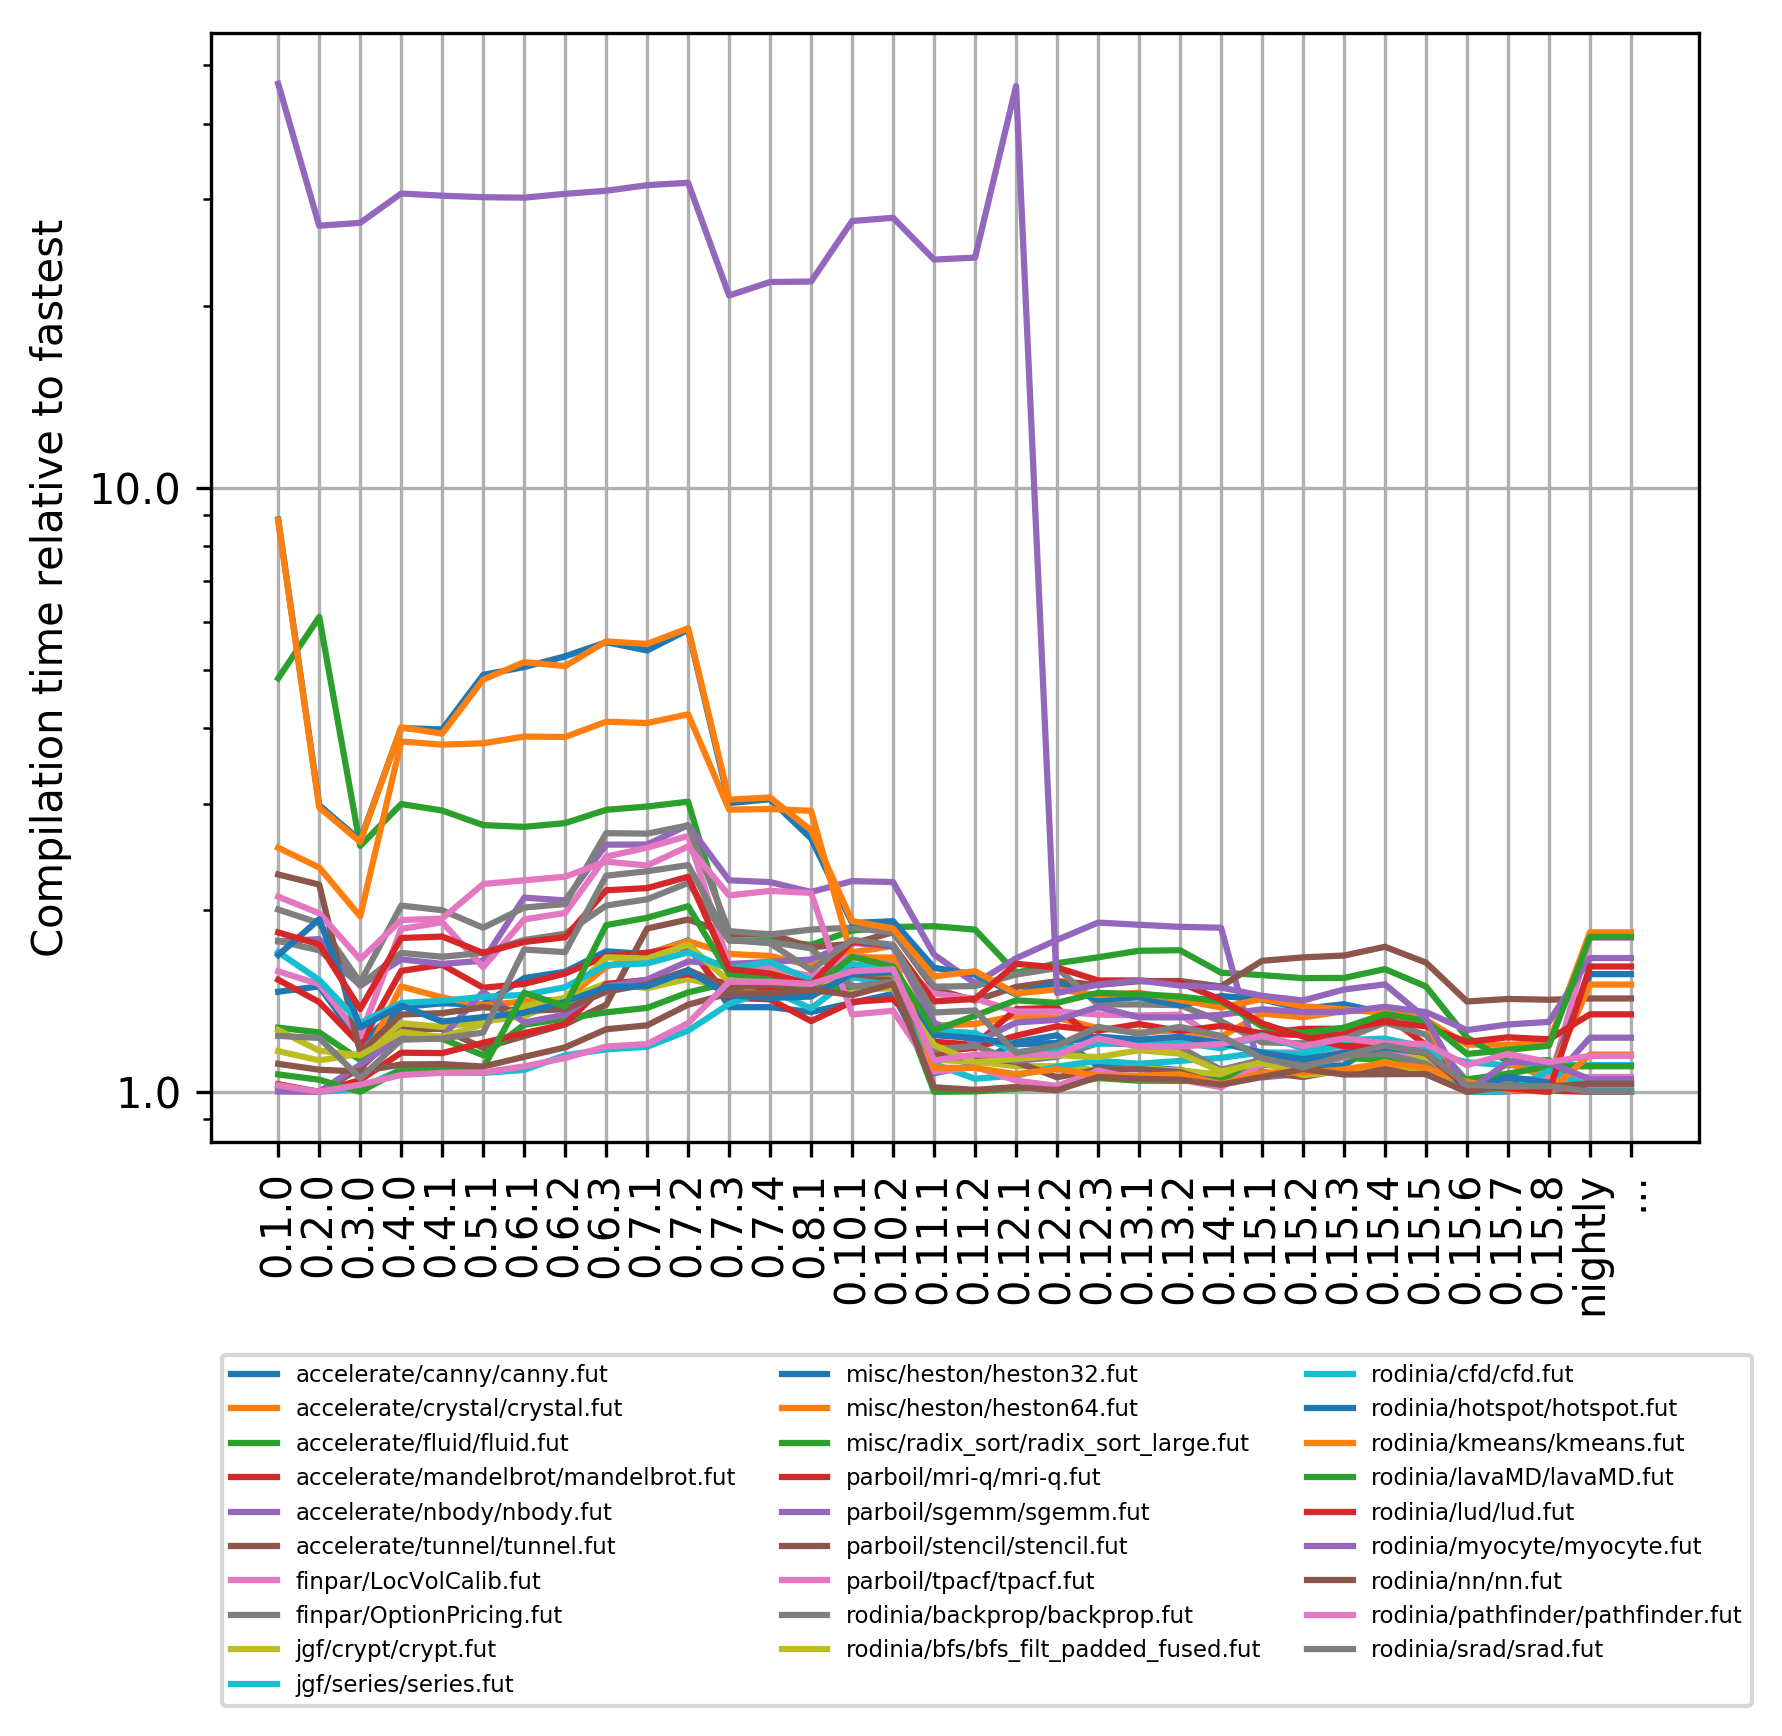
So that’s runtime performance, which we’ve always put effort into tracking and getting better at. What about compile times? Futhark is explicitly not designed to compile particularly fast, yet there have been times where I was so annoyed with the compile time of some program that I put effort into speeding up the compiler. However, we also add new time-consuming optimisations whenever they prove effective. So let’s look at a graph that shows relative compile time for each of the same benchmarks as before, on each version of the compiler:

The individual lines are much more tightly bundled than before, which shows as compile-times go, the changes tend to affect every program equally. (Note that this does not mean all these programs take the same time to compile - each is relative to its own fastest compilation.) One big exception is myocyte, which is by far the worst Futhark program that has ever been written. It is a more or less direct port of a C program, which we believe is a naive port of a FORTRAN 77 program, including such charming details as turning constant-size arrays into many independent variables. Ugh. The huge drop in compile time was due to a refactoring because I was simply too annoyed with having to wait so long for it.
The general compile-time slowdown for 0.4.0 was due to adding support for proper higher-order functions. We use defunctionalisation, so the compiler has to spend more time cleaning up the program. Still an easy price to pay for significantly improving the language. Compile times kept creeping upwards as we taught the compiler more tricks, until version 0.11.1, where I significantly sped up the simplification engine. I didn’t use any great algorithmic tricks here, just micro-optimisation, in particular speeding up the frequent case where a simplification rule does not apply.
The major slowdown in nightly is due to incremental flattening, which duplicates code, and hence significantly increases compile times. The previous post discusses a technique we can use to avoid this duplication when we know it isn’t necessary, but since the compile time for most of these programs is still on the order of seconds, it has not been annoying in practice. At least it’s nice to see that compile times are not yet completely out of control.